Analysis Dashboard
Generated on 2026-01-10
879382
Patients Analyzed
20+
Special Group Genes
Gene Frequency Analysis
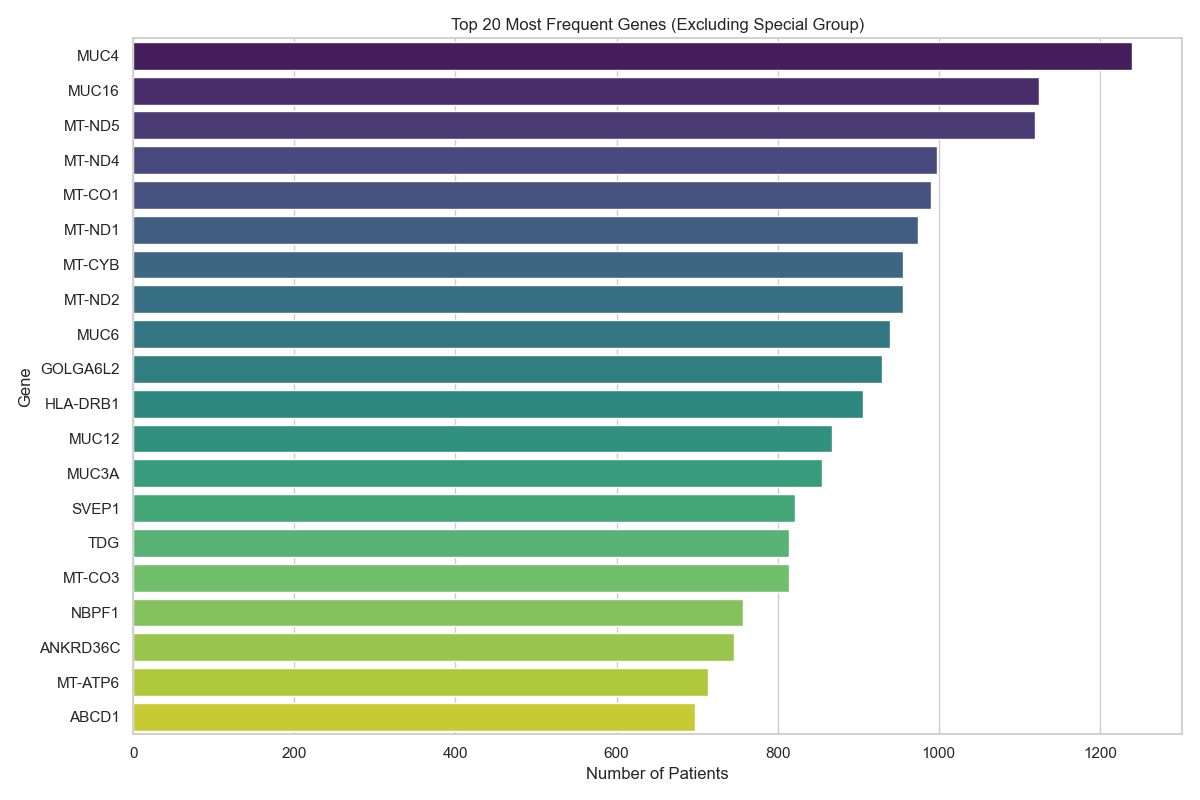
Top 20 Genes (Frequency)
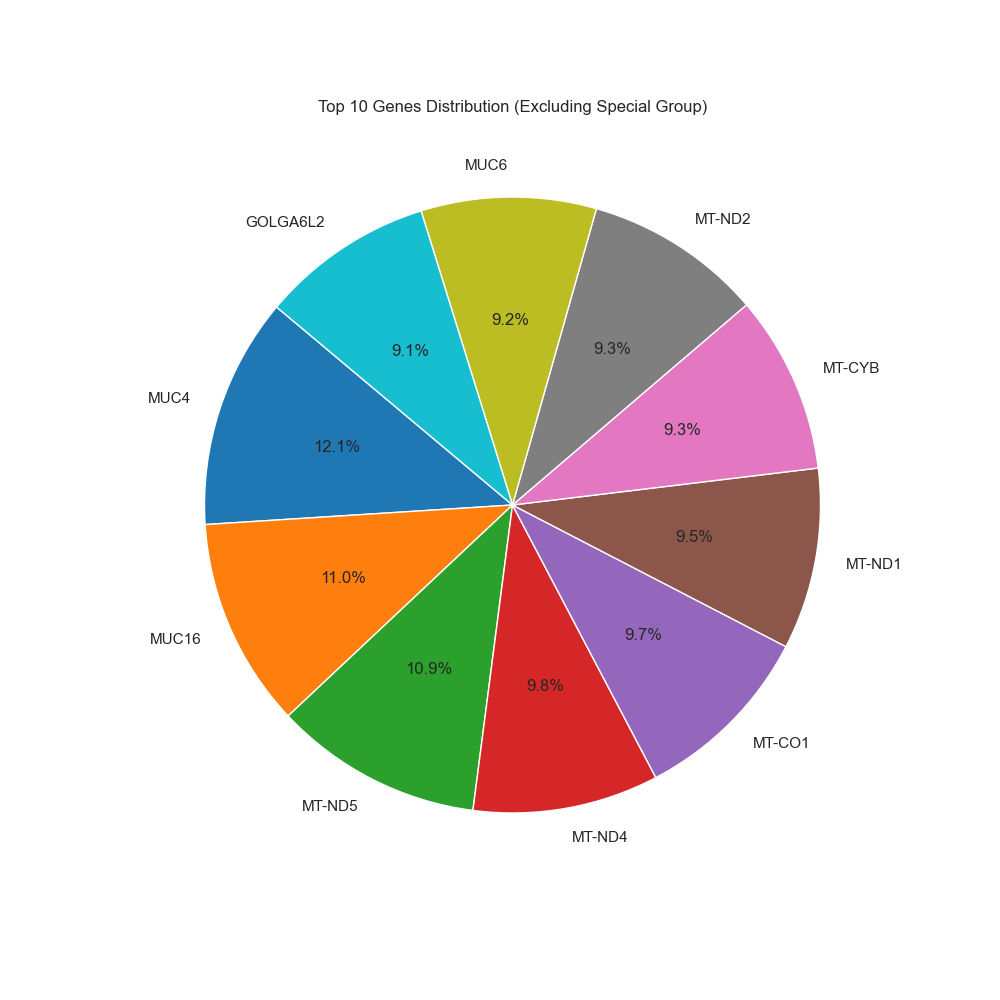
Top 10 Genes (Distribution)
📊 Explanation
The charts display the most frequently detected genes across the patient cohort.
Note: Non-gene items (e.g., column headers) have been filtered out.
Note: Non-gene items (e.g., column headers) have been filtered out.
| Rank | Gene | Patient Count | Percentage |
|---|---|---|---|
| 1 | MUC4 | 1240 | 99.12% |
| 2 | MUC16 | 1125 | 89.93% |
| 3 | MT-ND5 | 1119 | 89.45% |
| 4 | MT-ND4 | 998 | 79.78% |
| 5 | MT-CO1 | 991 | 79.22% |
| 6 | MT-ND1 | 974 | 77.86% |
| 7 | MT-CYB | 956 | 76.42% |
| 8 | MT-ND2 | 956 | 76.42% |
| 9 | MUC6 | 940 | 75.14% |
| 10 | GOLGA6L2 | 930 | 74.34% |
| 11 | HLA-DRB1 | 906 | 72.42% |
| 12 | MUC12 | 867 | 69.30% |
| 13 | MUC3A | 855 | 68.35% |
| 14 | SVEP1 | 822 | 65.71% |
| 15 | TDG | 814 | 65.07% |
| 16 | MT-CO3 | 814 | 65.07% |
| 17 | NBPF1 | 757 | 60.51% |
| 18 | ANKRD36C | 746 | 59.63% |
| 19 | MT-ATP6 | 713 | 56.99% |
| 20 | ABCD1 | 698 | 55.80% |
Special Group: Histone Modification & Chromatin Remodeling
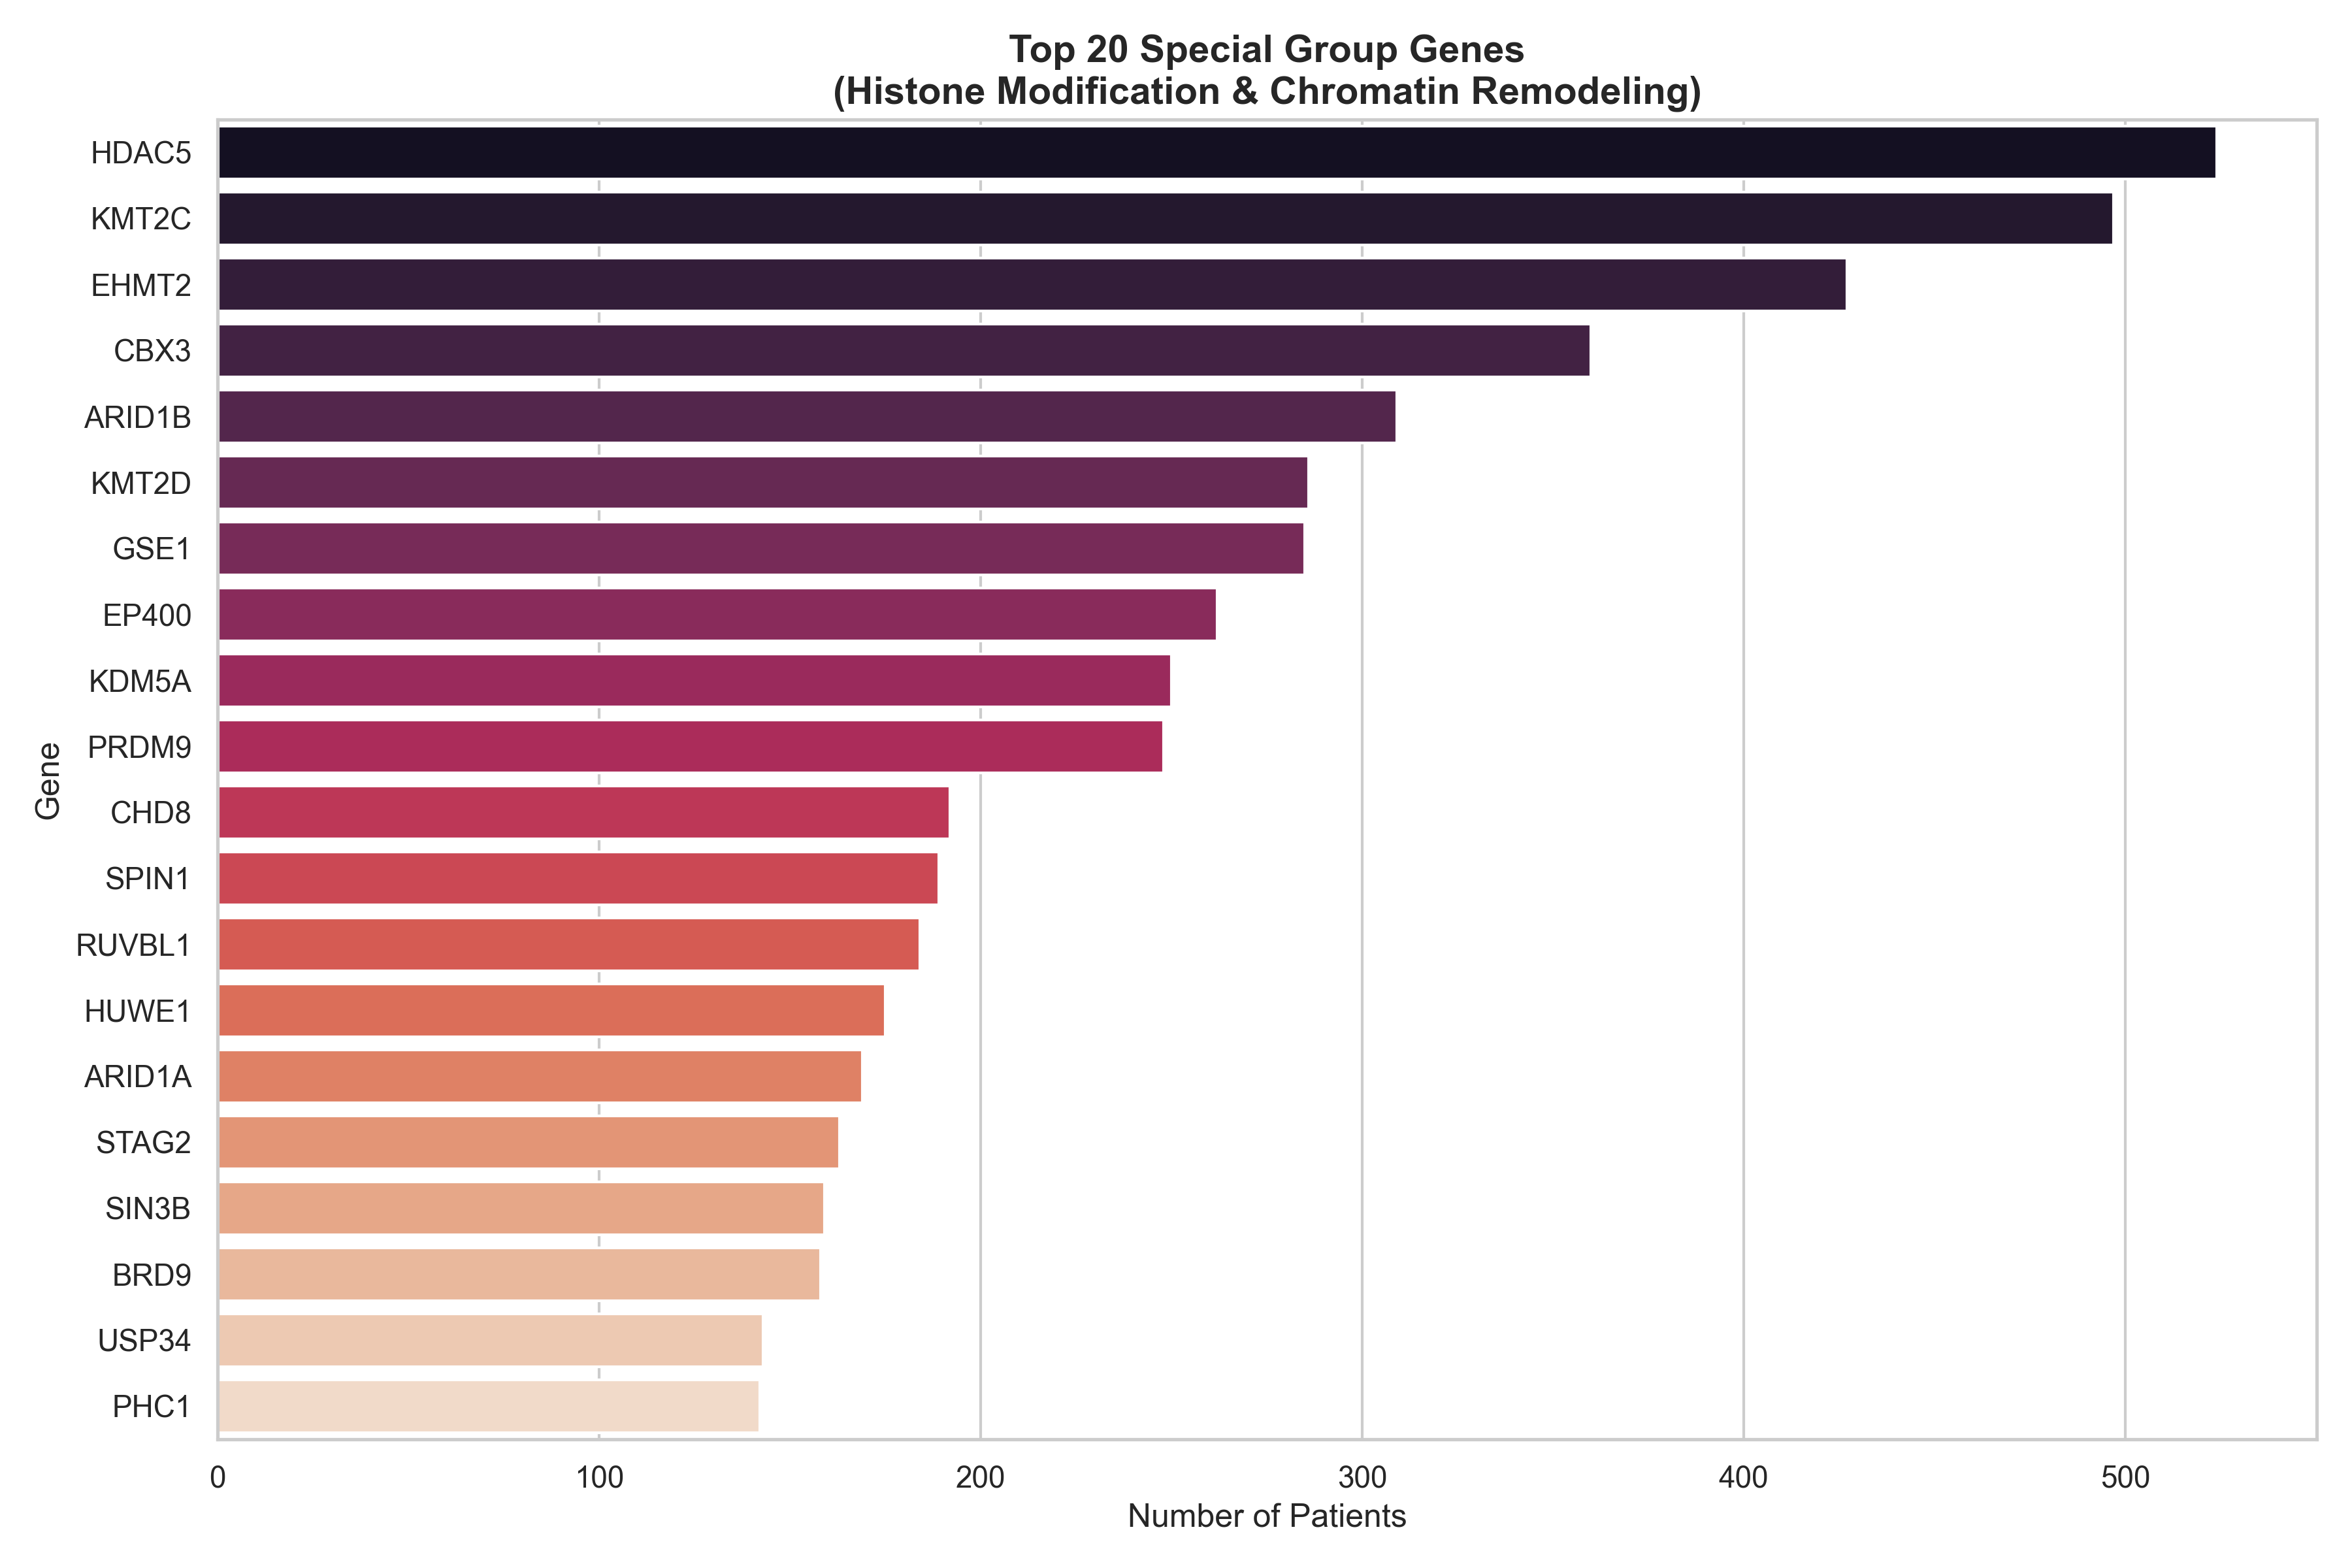
Top Detected Special Group Genes
🧬 Special Focus
This section highlights genes specifically related to Histone Modification and
Chromatin Remodeling (e.g., KAT, KMT, HDAC families).
These genes play crucial roles in epigenetic regulation and are of specific interest for this analysis.
These genes play crucial roles in epigenetic regulation and are of specific interest for this analysis.
Top 20 Special Group Genes Table
| Rank | Gene | Patient Count | Percentage |
|---|---|---|---|
| 1 | HDAC5 | 524 | 41.89% |
| 2 | KMT2C | 497 | 39.73% |
| 3 | EHMT2 | 427 | 34.13% |
| 4 | CBX3 | 360 | 28.78% |
| 5 | ARID1B | 309 | 24.70% |
| 6 | KMT2D | 286 | 22.86% |
| 7 | GSE1 | 285 | 22.78% |
| 8 | EP400 | 262 | 20.94% |
| 9 | KDM5A | 250 | 19.98% |
| 10 | PRDM9 | 248 | 19.82% |
| 11 | CHD8 | 192 | 15.35% |
| 12 | SPIN1 | 189 | 15.11% |
| 13 | RUVBL1 | 184 | 14.71% |
| 14 | HUWE1 | 175 | 13.99% |
| 15 | ARID1A | 169 | 13.51% |
| 16 | STAG2 | 163 | 13.03% |
| 17 | SIN3B | 159 | 12.71% |
| 18 | BRD9 | 158 | 12.63% |
| 19 | USP34 | 143 | 11.43% |
| 20 | PHC1 | 142 | 11.35% |
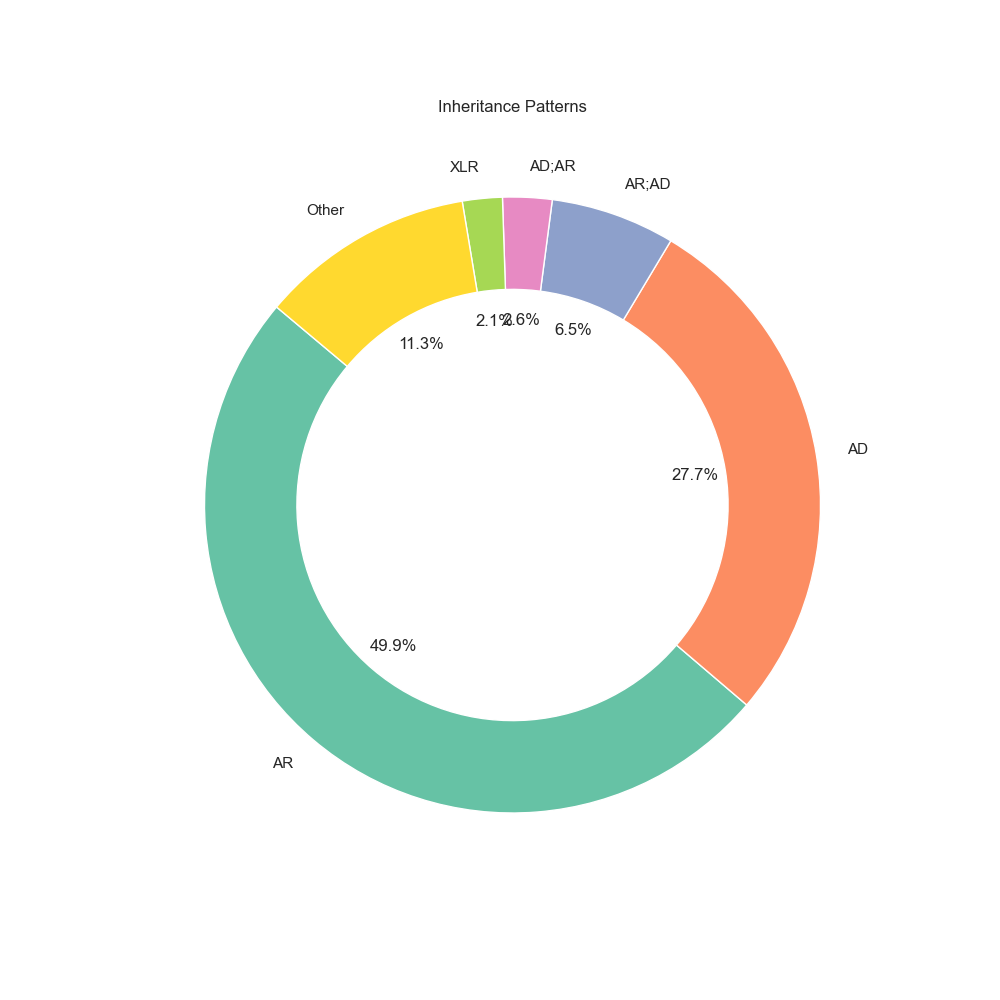
Variant & Inheritance Insights
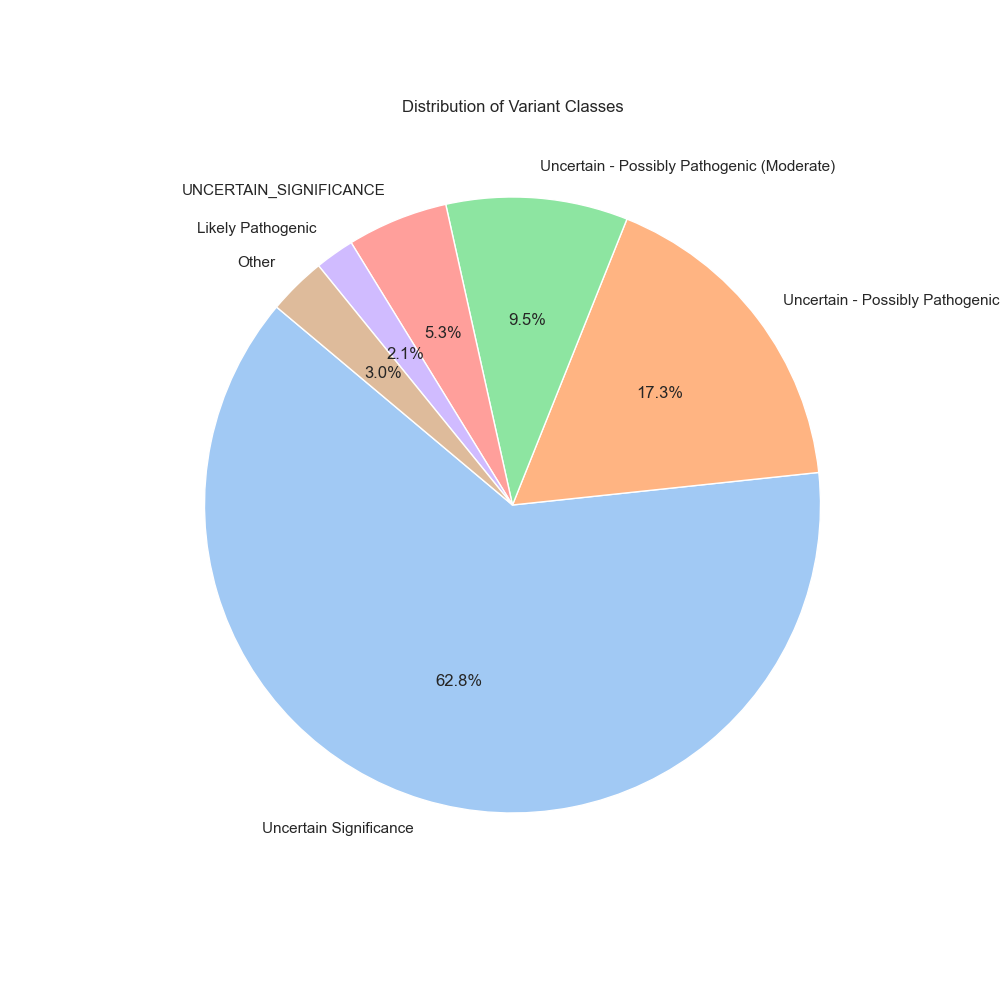
Variant Classification
Inheritance Patterns
Gene Co-occurrences
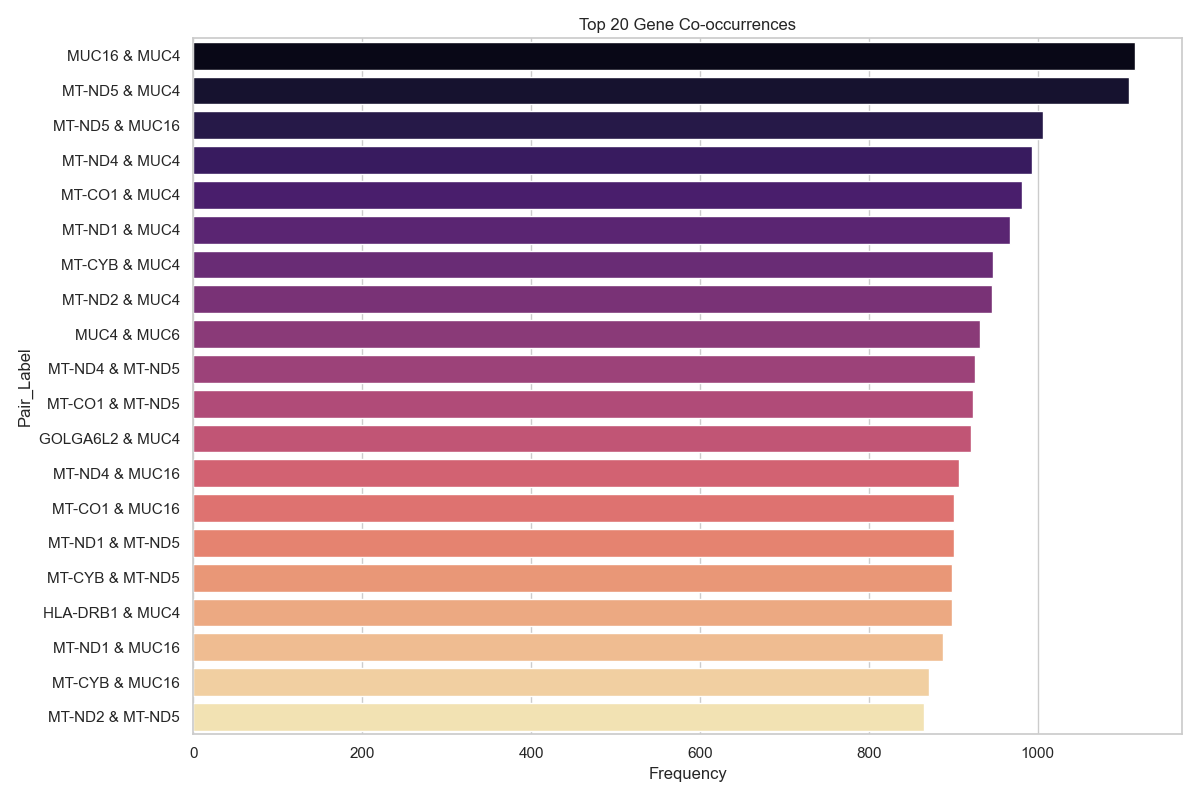
🔗 Explanation
This chart highlights pairs of genes that are frequently mutated together in the same patient.